
Why is energy important?
Energy represents three quarters of our greenhouse gas emissions
We rarely think about it, or maybe once a month when we have to pay our electricity and gas bills, or when we fill our cars' tanks – but energy is literally everywhere. Before we continue, let's just mention that by "energy" we often mean "energy carriers", which include all materials, substances or intermediate products (like electricity) that are useful to humans. This differs from the theoretical use of the word as physics would define it for instance (the E in E = mc2), except in the case of nuclear power. Here, clarification done.
The figure below shows the amount of primary* energy in the world until 2021. The three main energy carriers that dominate the global energy landscape, in order of useful energy delivered to human activities are oil, coal and natural gas. Unfortunately, these three sources emit large amounts of greenhouse gases – but we depend so much on them that the task of reducing these emissions is daunting.
*accounting for all losses between extraction and final use
OK thanks for the overview, but in Luxembourg?
Luckily, the European statistics institute, Eurostat, has a lot of information on what Luxembourg imports, produces, uses, and exports. Luxembourg imports 158000 TJ of energy in a year, while it produces almost 13000 TJ in the same time. There are a few remarks we can make from this picture:
- Luxembourg is highly dependent on imports, mostly because of oil products (diesel, gasoline, fuel oil, ...).
- Electricity is actually a small part of the energy used in Luxembourg,
- The share of electricity produced in Luxembourg is mostly green (yay!).
The Intergovernmental Panel on Climate Change (IPCC) recognizes that electricity should replace fossil fuels if we want to reach our greenhouse gas emission reduction targets. But this will only work if electricity is also produced from other sources than fossil fuels. In other words, we are not too sure how much energy is going to be consumed in the future, but we know a large part of it will have to be electricity, and a large part of this electricity will need to be from low-carbon sources.
OK, low-carbon electricity, what is that?
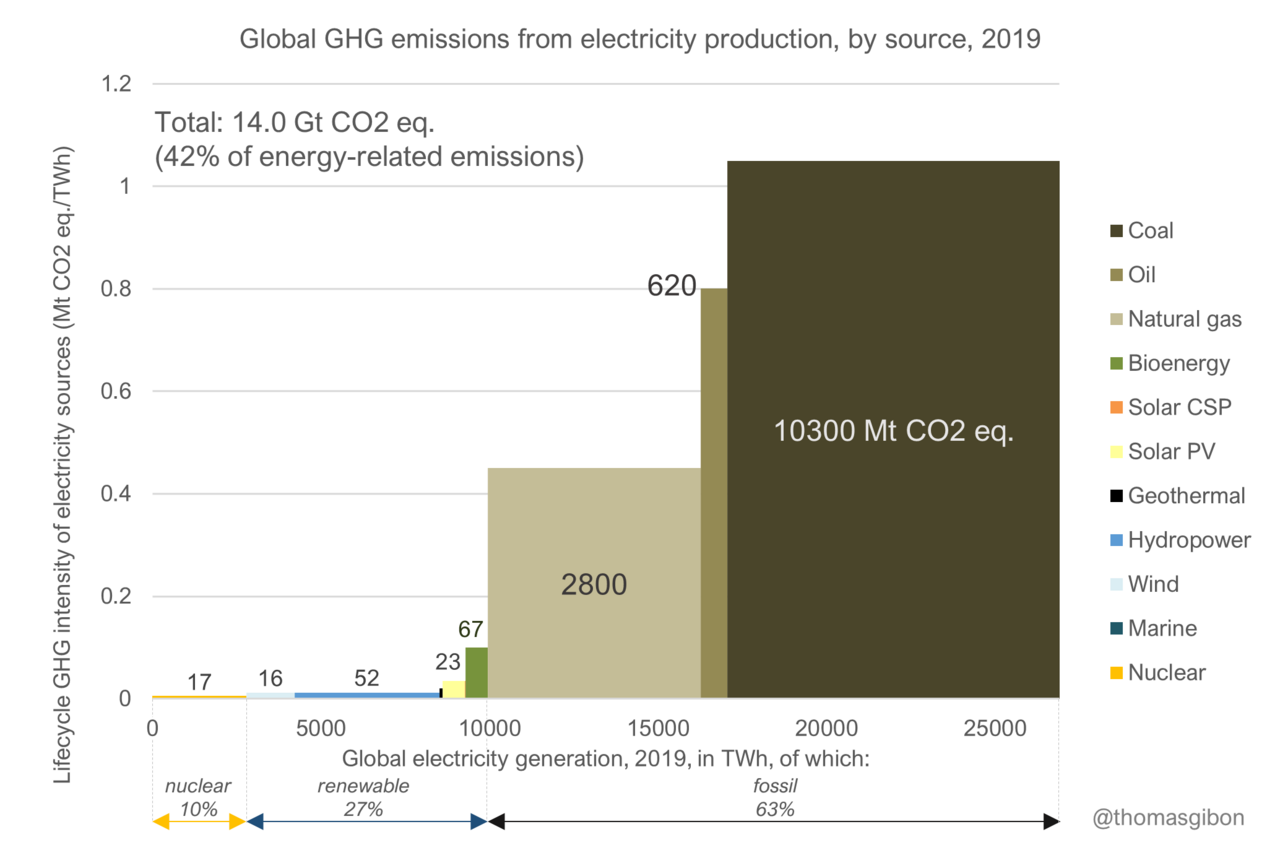
Low-carbon electricity is electricity that emits only low amount of greenhouse gases (GHGs), directly, and indirectly. Renewable electricity, such as wind, solar, and hydropower are low-carbon sources, and so is nuclear power (but it is not renewable). In contrast, fossil fuels burned to produce electricity release large amounts of carbon dioxide in the atmosphere to generate the heat that runs the turbines in power plants. Fossil-fuelled electricity still represents about 63% of all electricity generated in the world, while 27% is from renewable origin (mostly from hydropower) and 10% is from nuclear power.
You can see a representation below, both of
- the GHG intensity of each source, in kg CO2 eq./kWh (or Mt/TWh) on the y-axis,
- the global production of each source, in TWh, on the x-axis,
- the total amount of GHG emitted by each source, as the surface area of each rectangle.
It's quite impressive to see that coal only contributes to the emissions of more than 10 Gt CO2 eq., which is roughly 20% of ALL emissions of that year, globally. Another observation is that coal emissions are so high that it makes fossil gas acceptable as an alternative fuel. If we did not have coal or oil, do you think our perception of fossil gas would be different?
OK, that's 2019, but how did it look before?
Luckily we have time series to observe progress. But this time, let's get into further details and look at individual countries.
Let us see what electricity production technologies individual countries have been choosing since 2000, and what effect it has had on decarbonization. The following animation shows electricity mixes for different countries as bubbles, between 2000 and 2021. Bubble size is the annual total production, bubble position shows the mix composition, and bubble color is the amount of GHGs emitted for 1 kWh of each mix.